Tackling Food Fraud
Food fraud is one of the biggest challenges facing the food industry today, affecting both businesses and consumers. Food product authentication provides a solution to rebuild trust and protect brands.
Variations in the natural abundance of stable isotopes are expressed as a “relative difference of isotope ratios” (Coplen 2011), known as an “isotope-delta value” (Brand et al. 2014) using delta (δ) notation.
Delta values are dimensionless quantities that represent the difference in isotope ratio of a sample relative to an internationally agreed zeropoint (defined by the IAEA) as shown in equations (1) and (2).
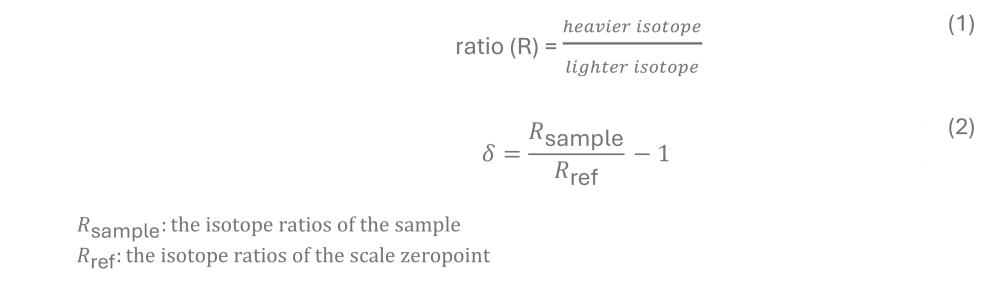
Isotope delta (δ) is the stable isotope ratio of a material expressed relative to a reference according to the example expression using carbon:

Metrological traceability
Isotope-delta values for hydrogen, carbon, nitrogen, oxygen and sulfur are traceable to international standards. Traceability of isotope-delta values is assured by calibration of measurement results using reference materials that are traceable to the international standards (a process often referred to as normalisation).
Reference Materials
For measurements of isotope delta, the calibration hierarchy takes the form of Reference Materials (RMs) with traceability chains linking their assigned isotope-delta values back to the zero points of the appropriate delta scale. Although nomenclature will vary, RMs for isotope ratio measurements may be broadly classified as:
(1) Primary RMs
(2) Secondary RMs
(1) and (2) often referred to as Certified Reference Materials (CRMs)
(3) In-house (laboratory) RMs or In-house standards
The CRMs for an isotope-delta scale realise the position of the zero-point. In some instances, a CRM can both realise and define the zero-point when it’s assigned isotope ratio is zero.
Stable isotope laboratories must hold suitable materials for calibration and normalisation purposes so that isotope ratios can be reported on an agreed international scale. CRMs are not recommended for daily use as they are in short supply. Instead, CRMs are used to calibrate in-house RMs for everyday use in normalisation and quality assurance (QA).
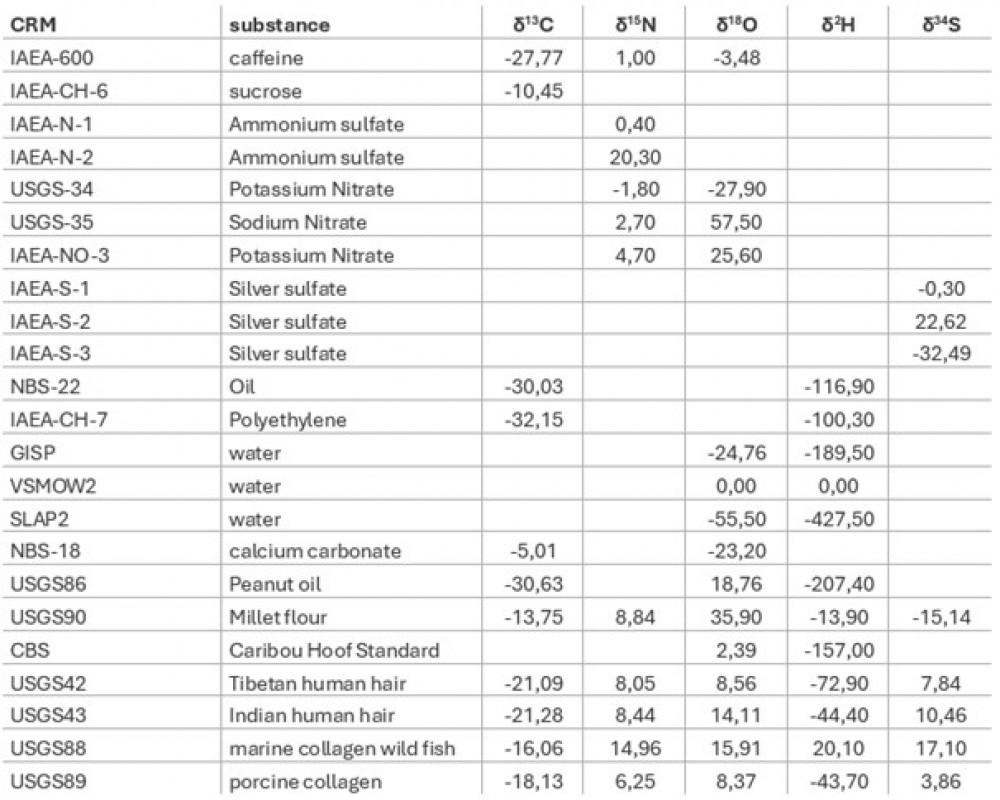
At least two RMs of known isotope ratio are used to normalise results. Table 1 presents a list of the CRMs used in the laboratory for IRMS analysis, depending on the element, the sample type and the matrix.
Measurement uncertainty (MU)
Estimating the MU associated with two-point scale calibration (like in IRMS) requires appropriate methods to combine uncertainty components such as the use of partial derivatives of the measurement equation, or a Monte Carlo simulation. One of the most straightforward approaches is to use a spreadsheet-based calculation (Kragten spreadsheet approach to measurement uncertainty). The Kragten spreadsheet approach to the calculation of MU avoids the use of partial derivatives, does not require macros or other coding and can handle situations where the same term appears more than once in a calculation formula. This approach calculates an uncertainty budget, which will help the end-user discover if any particular contributing factors are responsible for a large proportion of the MU.
Quality control
To monitor the day-to-day performance of IRMS measurements the d values for in-house RMs and QC materials (after applying all necessary corrections and normalisation) are compared to a target value or mean value control chart with defined limits. The normalisation (stretch and shift-correction) values (for each element) are also recorded together with the normalised values obtained for in-house RMs. Mean value control charts have warning limits (mean ± 2 σ) and control limits (mean ± 3 s).
It is fundamentally important that samples, RMs and QC materials are prepared and analysed in an identical manner, according to the Principle of Identical Treatment [Werner and Brand 2001].
Table 1. Certified Reference Materials used in the laboratory
Further information about IRMS principles can be found in: - Brand, Coplen, Vogl, Rosner, Prohaska. 2014. Assessment of International Reference Materials for Isotope-Ratio Analysis (IUPAC Technical Report). Pure and Applied Chemistry 86: 425-467. - Coplen, 2011. Guidelines and recommended terms for expression of stable-isotope-ratio and gas-ratio measurement results. Rapid Communications in Mass Spectrometry. 25, 2538-2560. - Dunn., Carter, eds., 2018. Good practice Guide for Isotope Ratio Mass Spectrometry (second edition), FIRMS. ISBN 978-0-948926-33-4 - Skrzypek, et. al. 2022. Minimum requirements for publishing hydrogen, carbon, nitrogen, oxygen and sulfur stable-isotope delta results (IUPAC Technical Report). Pure and Applied Chemistry, vol. 94, no. 11-12, 2022, pp. 1249-1255. https://doi.org/10.1515/pac-2021-1108 -Werner, , Brand, 2001. Referencing Strategies and Techniques in Stable Isotope Ratio Analysis. Rapid Communications in Mass Spectrometry 15, no. 7: 501-519.
Food fraud is one of the biggest challenges facing the food industry today, affecting both businesses and consumers. Food product authentication provides a solution to rebuild trust and protect brands.
Publications based on Customs seizures data. The ITR is publicly available and includes areas of enforcement and security; environmental protection and cultural heritage.
This year’s Food Safety Briefing theme is science and data – with four special guest experts from Mars Global Food Safety Center, the Food Standards Agency, Unibloc, and Imprint Analytics joining to share their knowledge.
Interesting food fraud documentary by Bénédicte Delfaut, first released in 2021 by Java Discover
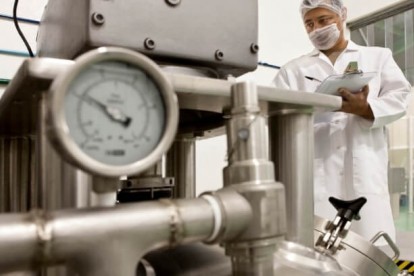
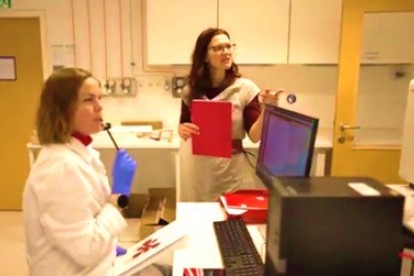
What is it like to work as a Quality Manager in a Lab? Video of an Austrian initiative to show girls and young women the many possibilities of choosing a course of study leaving behind classical role stereotypes.
Webinar on demand with David Psomiadis from Imprint Analytics, Jackie Healing from NSF International and Andy Kerridge from ellow of Institute of Food Science and Technology